Understanding peak performances can be tricky considering how many variables you need to take into account. When I was a pro cyclist, we all talked about ‘form’. When we were ‘on form’, each of my teammates and peers on the pro circuit talked about having good ‘form’. The legs just felt great, the days of ‘no-chain’, the days we were just ‘on’ and the times when we knew that no one was going to beat us today. We all knew what it was, but could never really describe it. What exactly was ‘form’? Where did it come from and how did one actually acquire this mysterious ‘form’?
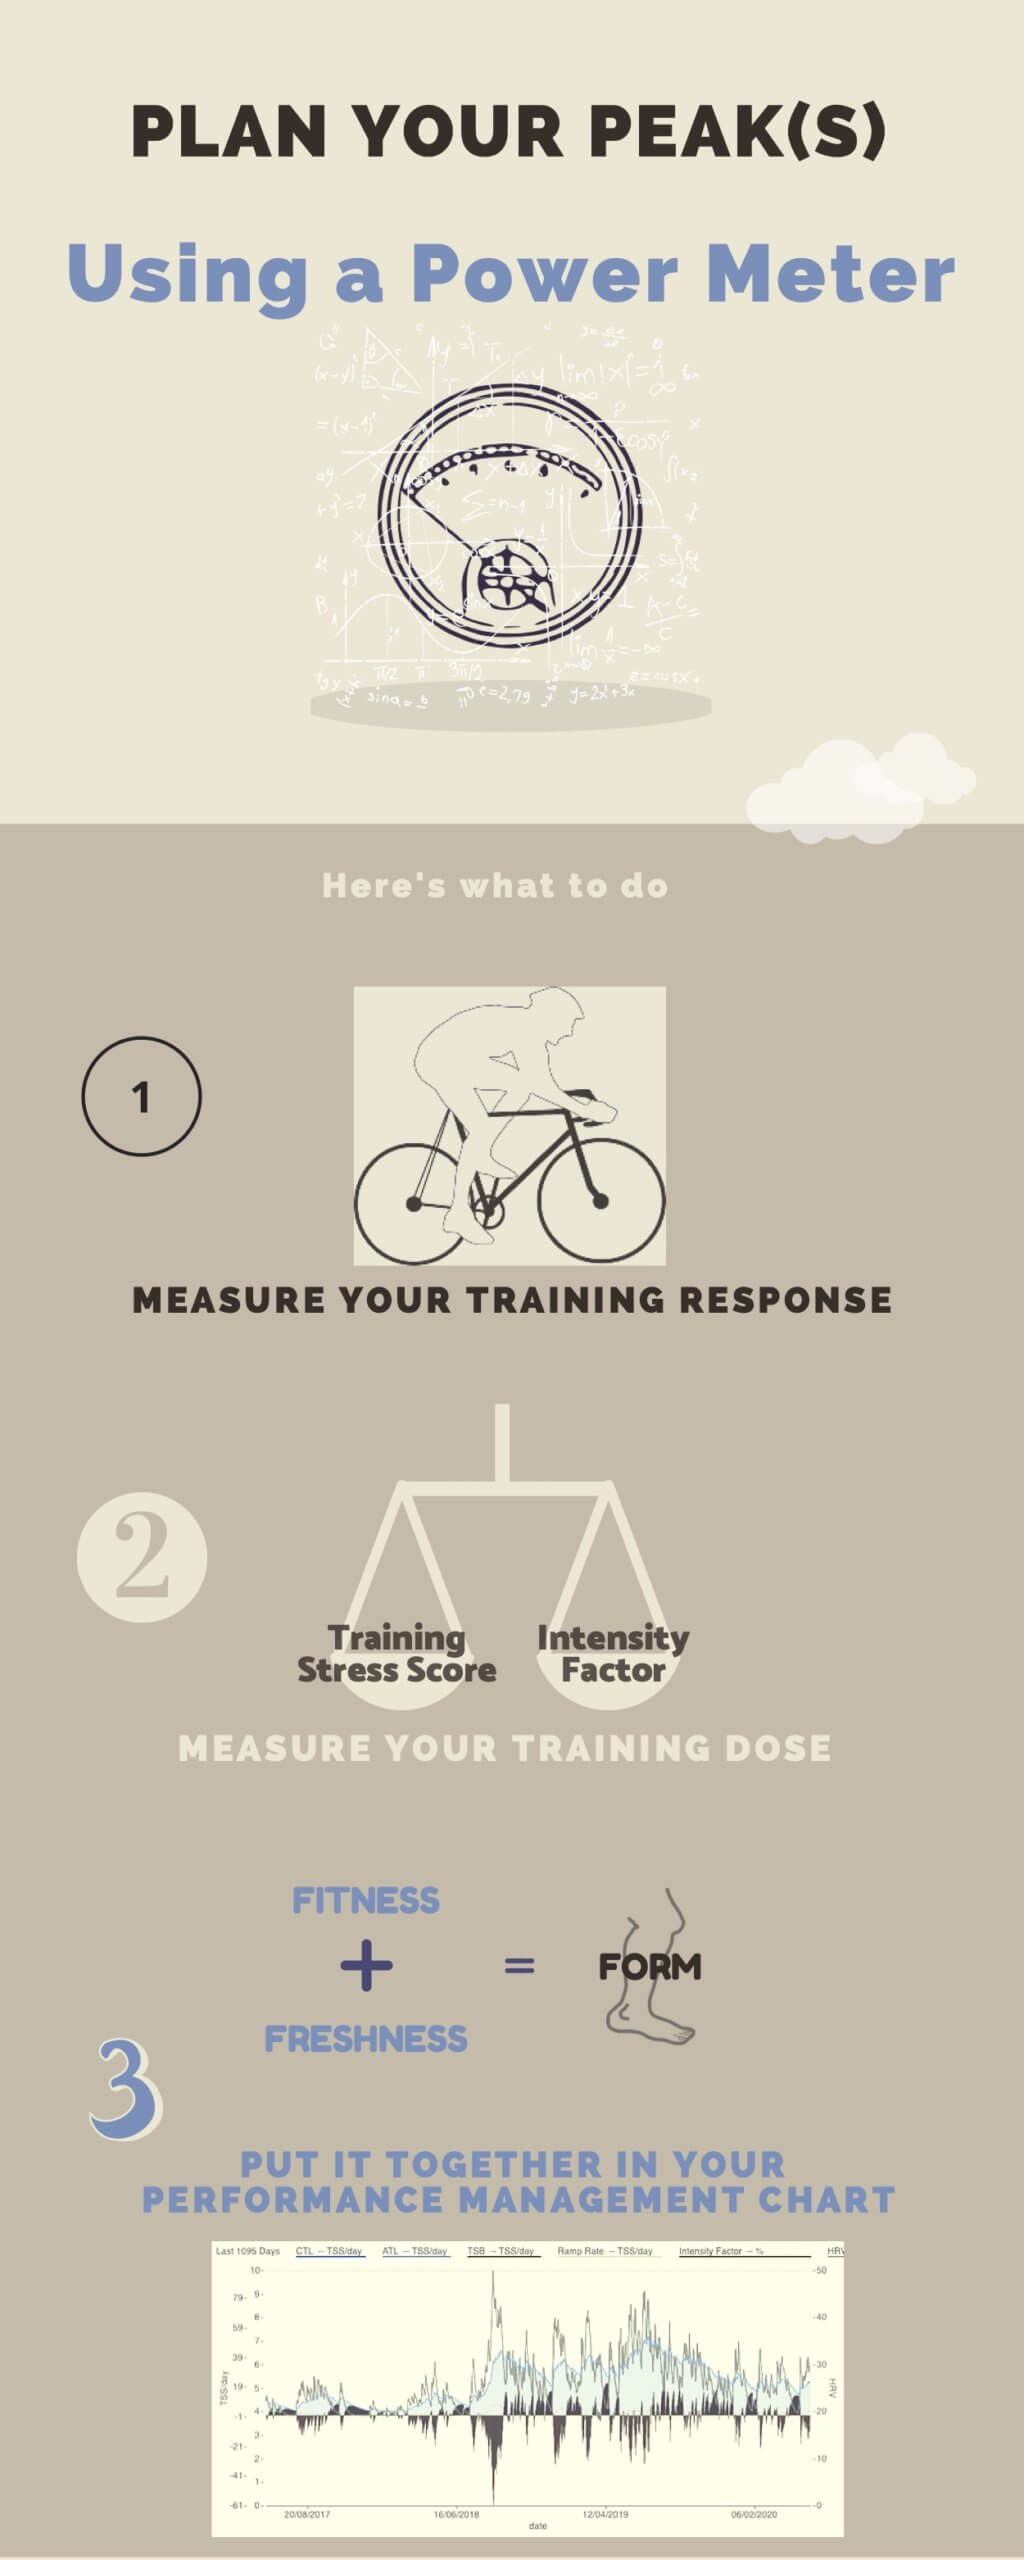
The steps to understanding your peak performances
Now fast forward to when I began to coach athletes after retiring from pro cycling. At this time, I become responsible to my athletes in creating ‘form’ for them. Not only did I want to make sure that they acquired this nebulous thing called ‘form’, but I wanted them to have it when their “A” races were scheduled. And herein lies the challenge: How can you achieve ‘form’ exactly on the day or period of time that you want to have it? How will you know that the training you are doing now, will give you the necessary ‘Peak’ when you want it? Are you training too hard? Are you training hard enough? What about the type of training? Are you training in the proper training zones? Do you get enough variety in your training to make sure each physiological system is improving? All of these are questions that I had when I was racing and also when I was developing detailed training programs for my clients.
Data and your training ‘response’
When the power meter came along and I started thinking about how to best use a power meter from the perspective of building a training plan, I wanted to be able to quantify each training ‘dose’. Because truly, understanding the training ‘dose’ and the resulting ‘response’ is the only way to really understand the exact ‘ingredients’ needed to bring about success. If the training ‘dose’ wasn’t large enough or of the wrong ‘ingredients’ then we would be able to easily understand the ‘response’ and therefore make changes as needed.
The advent of the power meter or more specifically, the ability to record every second the wattage, heart rate, cadence, etc. has allowed us to exactly quantify the training ‘response’. With the ability to download a digital record of each ride, and analyze this data, has come the ability to more thoroughly understand the ‘response’ of the training ‘dose’. On the other side of the coin, the power meter gives us the ability to prescribe precisely the training ‘dose’.
Gone are the days of riding for 4 hours and just randomly training and hoping that 4 hours would be enough to make you fit for the upcoming race. You see, time and distance are the only things that we have been able to really periodize our training load by until now. Heart rate, rate of perceived exertion, Vo2 max, these are ‘responses’ to the training ‘dose’ or watts.
Quantifying the training ‘dose’
Now, as a coach, I can be more specific with the training that I prescribe to my athletes. Do 45 minutes at 89% of your functional threshold power (FTP) each day and then within 4-6 weeks, we’ll see the ‘response’. With a power meter we are easily able to see the results of our hard work over time, but, as a coach, I really needed to be able to quantify the exact training ‘dose’ more simply than 2 x 20 minutes at FTP and 6x 5 minutes at Vo2 max power. I needed a score. I shared all this with Dr. Andrew Coggan, a great friend and brilliantly smart sports scientist with whom I shared many of my training/coaching ideas. Within 2 weeks he came back to me with “Training Stress Score” in which each ride would be given a score based on the exact training load or training dose was achieved. This was based on Dr. Bannister’s work on a Heart Rate based score called TRIMP or “Training Impulse”.
Training Stress Score & Intensity Factor
Training Stress Score (TSS) was based on the simple premise that you score more points for the more time you spend at your FTP and above it. To set the standard, an hour at FTP would be equal to 100 TSS points. Within this TSS, you also had to account for intensity, therefore along with a TSS given for each ride, a measurement of intensity was given as well, which Dr. Coggan called Intensity Factor (IF). An hour at FTP would score an IF of 1.0.
Instantly, with the creation of these two metrics, we had the beginnings of the ability to periodize training with a power meter. We now had a way to simply understand the training ‘dose’ and we could analyze the training ‘response’ with software, by tracking fitness changes over time.
Uncovering the mystery of ‘Form’
Just understanding the training ‘dose’ and ‘response’ doesn’t get us to the pinnacle of (in my mind), or the goal of a good coach: To create ‘form’ at the exact time an athlete wants to have ‘form’. As a coach, I can make anyone fit. That’s not too hard, just do these intervals, ride this much, push yourself this hard, etc. and the fitness will be there. However, fitness isn’t ‘form’. It’s lacking a key component. I was recently chatting with a several time Tour De France winner and I asked him, “What is form?”. He had been ‘on form’ many times, and knew inherently what it was when he felt it in his body, but he couldn’t come up with the words to describe it. At the end of the Tour De France, he wasn’t ‘on form’, he was fatigued and severely ‘over-reached’ from a training state, however he had lots of fitness! On the other side of the coin, he currently isn’t very fit, but he is very ‘fresh’ from not exercising as much as he used to, so again he doesn’t have ‘form’.
However, these are the keys to ‘form’. Dr. Coggan so very elegantly defined ‘form’ as Fitness+Freshness. You have to have the correct balance of fitness and freshness and that is what creates this magical thing called ‘form’.
Fitness
Within Fitness, we have 2 other components: Chronic Training Load (CTL) and Acute Training Load (ATL). Chronic Training load is the load or dose of training over a longer period of time, so for simple terms, it takes into account every training ride you have done in the last six weeks. The training you did six weeks ago IS impacting you today. Acute Training Load (ATL) is the training you have done in the last seven days (both CTL and ATL can vary from individual to individual) , so the training you did last weekend is impacting you now as you read this. |
Freshness
By balancing them correctly and carefully you can create a high level of fitness along with a high level of freshness thereby managing ‘form’. We call this ‘Training Stress Balance’ (TSB). When your TSB is a positive number, it tells you that you are becoming fresh and that as long as you have fitness backing you up, you could have a ‘Peak’ performance. The higher the positive TSB, the greater the freshness. When the TSB is a negative number, than this means that you are not very fresh and are currently in some kind of a fatigued state. The more negative the number, the more fatigued you are likely to be.
|
Understanding Peak Performances management
Once this simple equation was understood, then figuring out how to manage form(create it at the right time), became possible. All this work now finally brings us the point of this article: The Performance Mangement Chart. This chart in WKO5 allows you to see exactly how your Training Stress Score (TSS) or ‘dose’ of training impacts your ‘form’, or the ultimate ‘response’ to the training ‘dose’.
In the below chart, you can see the dark blue line of Chronic Training Load (CTL) , the pink line of Acute Training Load (ATL) and then the yellow line of Training Stress Balance (TSB). Note on the y-axis you can see the ‘zero point’ for TSB. Any yellow line above that ‘zero point’ will indicate that you have the chance of a good ride, a day in which you are just ‘on’.
Applying theory to a real case
This particular chart represents an athlete that initially put all of his ‘eggs in one basket’ for a race in mid- June. His entire season was built around around this race and this is evident, by the CTL (dark blue) line and how it continually builds to a ‘summit’, which would indicate that this athlete would have the highest level of fatigue for the season around this time period. After this mid-June time period, you can see that he began tapering by reducing his ATL significantly, which in turn reduced his CTL, albeit at a slower rate. By reducing his training load or dose, this is what causes him to become fresher. As we look closer at this time period, we see that his TSB goes from -36.6 to +37.5 on June 11th, the day before his goal race. We also observe that he achieved his highest mean maximal power (MMP) for 20 minutes for the entire year on the day of his goal race! SUCCESS!
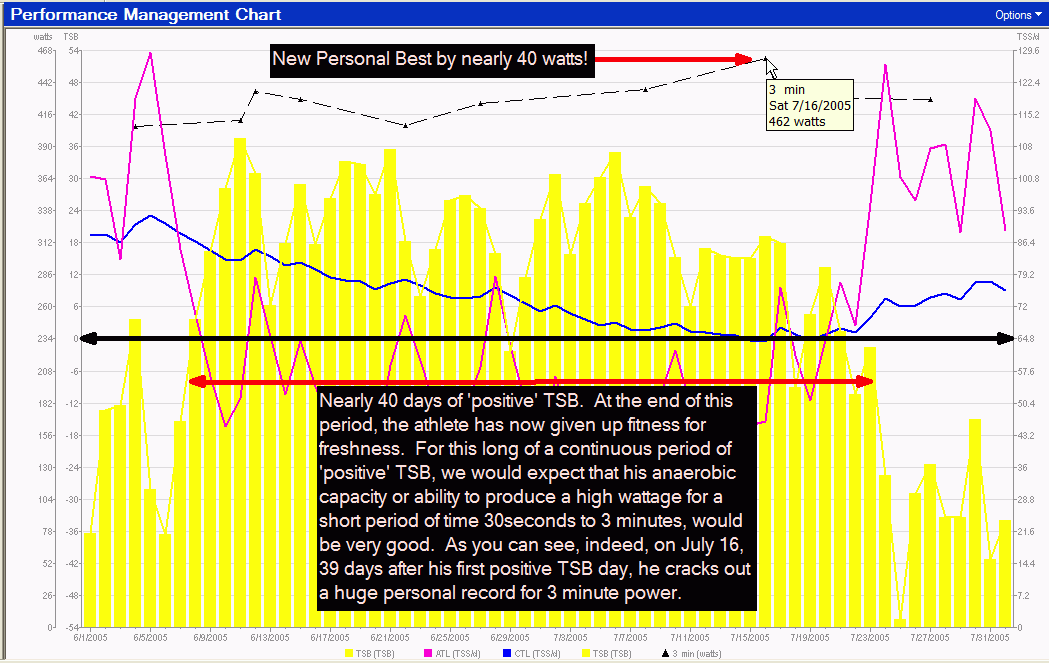
Once he had achieved his goals, during this June time period, he continued to allow his CTL slide, become fresher, but eventually giving up some fitness.
You can see that he had over 40 days of ‘positive’ TSB. This is quite a large reduction in his current ATL and therefore, he continues to become more and more fresh through the middle of July. Typically, the fresher you are (to a certain extent), the better you will be able to produce higher and higher watts for these anaerobic efforts. We see that indeed this is true in this example. On July 16, with a positive TSB of 19.2, he absolutely crushed his previous personal best for 3 minute power by nearly 40 watts! Again, the Performance Manager predicts exactly what happened in reality!
A modern view on a classic model of understanding peak performances
In coaching, training and the periodization of training, nothing has changed really. The same principles apply that Dr. Tudor Bompa put forth back in 1968, you still have to build, taper and rest in order to create an overload and then adaptation to that new level of stress. The art of coaching is still very much alive, and as a coach, I have to still rely on all the years of personal experience from racing, from working with all levels of athletes and also from my ‘gut’ instinct. However, what has changed is our ability to accurately quantify training ‘dose’ and ‘response’ with the use of a power meter. This is the revolution. This is truly something that is changing the way that all athletes and coaches look at training. With the addition of the Performance Manager Chart in the WKO5 software, we now are learning how better to predict peaks of fitness and also when you need to rest to prevent from overtraining.
By understanding these simple concepts in this article, and using your power meter, you are well on your way to exceeding your goals next season. May your FTP always increase!
This article is part of a series of articles initially written and published by Hunter Allen on Peaks Coaching Group , which we share here thanks to our partnership. Hunter Allen conducts monthly power training webinars. They are a great and economical way to continue learning about training and using a power meter.Previous webinars are for sale “On Demand” as well. Check out webinars and his coaching site at www.PeaksCoachingGroup.com Hunter also has online training programs available at www.TrainingPeaks.com/hunter and follow his twitter @hunterpeaks

Like it ? Share it !